
Performance Analytics Data is everywhere. Every sale, every website click, every customer email, every internal process—almost everything your business does leaves a digital footprint. Studies consistently show that companies using data properly see more than 5% gains in productivity and over 6% improvements in profitability. Yet many teams still make day-to-day decisions based mostly on gut feelings.
That gap between “having data” and “using data” is where performance analytics comes in.
Performance analytics helps you connect the dots between effort and outcome. It shows you what’s working, what isn’t, and where to focus next. More than 70% of business leaders say data helps them make faster decisions. The real magic, though, isn’t in the numbers themselves—it’s in turning those numbers into clear, practical insight.
If you’re new to performance analytics, this guide will walk you through the basics in plain English. No jargon. No complex math. Just a simple, structured explanation of how to use performance analytics to make better decisions and grow your business.
What Is Performance Analytics?
At its core, performance analytics is the practice of measuring, analyzing, and improving results using data instead of opinion.
Rather than asking, “Do we think this is working?”, you ask:
-
What actually happened?
-
How does that compare to our goals?
-
What patterns can we see in the data?
-
What should we change based on what we’ve learned?
Performance analytics:
-
Tracks activities and outcomes over time
-
Compares real results with targets or benchmarks
-
Highlights trends, patterns, and gaps
-
Supports better, faster decisions
You can apply performance analytics to almost any area:
-
Operations and processes
-
Finance and profitability
-
Sales and marketing
-
Human resources and people performance
-
Customer experience and digital platforms
The purpose stays the same everywhere: use facts to improve performance and reduce guesswork.
Why Is Performance Analytics Important?
Business environments change quickly. Customer preferences shift, competitors move, costs rise and fall, technology evolves. If you rely only on instinct in that kind of world, you’re effectively driving with your eyes half-closed.
Performance analytics helps you open them fully.
Here’s why it matters:
-
It replaces assumptions with evidence.
You move from “I feel like this campaign is working” to “Here’s the data showing its impact.” -
It speeds up decision-making.
When you have the numbers in front of you, you spend less time debating and more time acting. -
It sharpens focus.
Instead of tracking every metric possible, you zero in on the ones that actually tie to your goals. -
It supports accountability without micromanagement.
When performance is visible through shared metrics, teams know what’s expected and leaders don’t need to hover.
In short, performance analytics helps you make smarter decisions, faster—and with more confidence.
Key Objectives of Performance Analytics
So what exactly are you trying to achieve when you use performance analytics? Several core objectives show up again and again.
1. Visibility
You want a clear, honest picture of how the business is performing right now:
-
Are we hitting our targets?
-
Where are we ahead?
-
Where are we falling behind?
Visibility is like turning the lights on in a dark room—you see what’s really there.
2. Alignment
Analytics helps ensure that:
-
Day-to-day activities match long-term strategy
-
Teams know how their work supports business goals
-
Everyone pulls in the same direction
When people understand how their actions tie to outcomes, alignment happens more naturally.
3. Continuous Improvement
Performance analytics isn’t a one-off project. It’s a loop:
-
Measure → Analyze → Learn → Adjust → Measure again
You spot strengths to build on and weaknesses to fix. Over time, small changes add up to big improvements.
4. Risk Reduction
Early warning signals matter:
-
A dip in sales conversion
-
Slower customer response times
-
Rising churn rates
Analytics helps you see issues while they’re still small, so you can act before they turn into serious problems that hurt revenue or reputation.
How Does Performance Analytics Work?
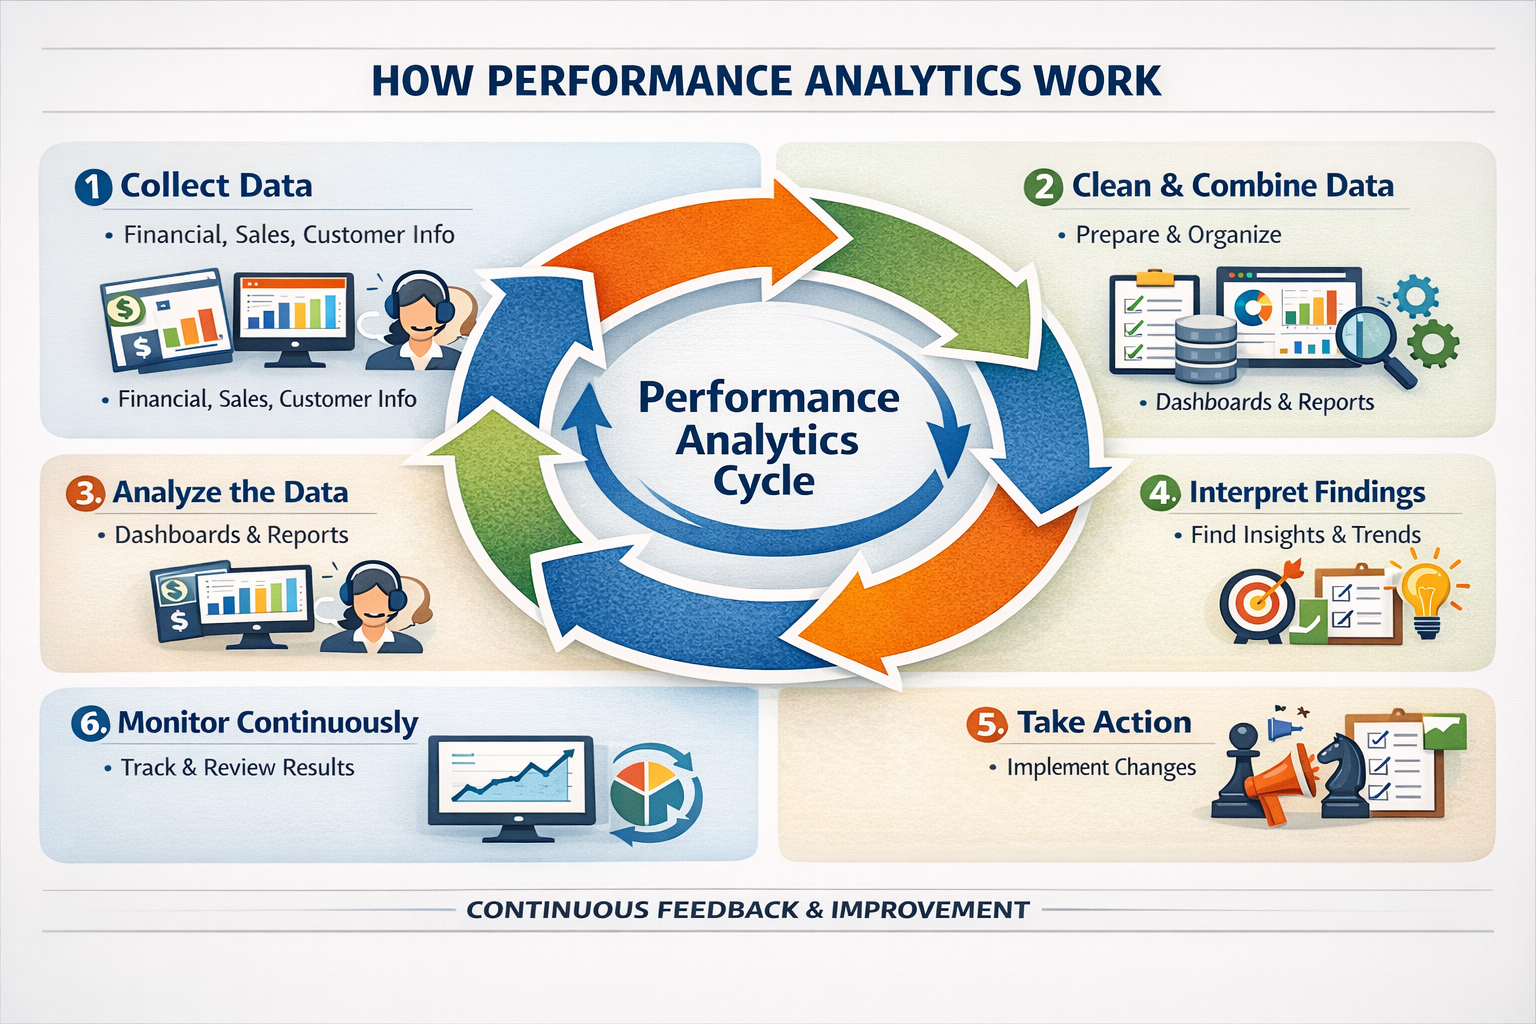
Think of performance analytics as a cycle rather than a one-time report. Here’s how it usually works in simple steps.
1. Collect Data from Multiple Sources
You start by gathering raw data from places like:
-
Financial systems (revenue, costs, margins)
-
Sales and CRM tools (leads, conversions, opportunities)
-
Customer interactions (support tickets, emails, chats, feedback)
-
Operations (production rates, delivery times, error rates)
The idea is to capture what’s actually happening across the business.
2. Clean, Combine, and Organize the Data
Raw data is rarely neat. You may need to:
-
Fix errors and missing values
-
Standardize formats (dates, currencies, IDs)
-
Combine data from different systems into one view
This step is crucial. If your data is messy, your insights will be unreliable.
3. Analyze the Data
Once the data is ready, analysts and managers use tools like:
-
Dashboards
-
Reports
-
Charts and graphs
-
Statistical models
They’re looking for:
-
Patterns (e.g., “Sales spike at month-end every time we run this promo”)
-
Trends (e.g., “Customer satisfaction is slowly dropping over the last three months”)
-
Anomalies (e.g., “Why did this region suddenly outperform all others?”)
4. Interpret the Findings
Analysis is just numbers. Interpretation turns those numbers into meaning:
-
What do these trends tell us?
-
Are we moving toward or away from our goals?
-
Which KPIs are improving, and which are declining?
-
What might be causing these changes?
This is where key performance indicators (KPIs) come in, helping you evaluate progress against specific goals.
5. Take Action and Adjust
Insights are only useful if they lead to action. Based on what you learn, you might:
-
Adjust your strategy
-
Change processes
-
Reallocate budget
-
Launch experiments
-
Train or support teams differently
6. Monitor Continuously
Performance analytics is not a closed loop. You keep:
-
Tracking results
-
Comparing new data with old
-
Fine-tuning strategies
This constant feedback creates agility—you respond to market changes and customer needs much faster.
Types of Performance Analytics
Not all analytics are the same. Different types answer different questions. When you understand them, you can use the right tool for the right problem.
1. Descriptive Analytics – “What Happened?”
Descriptive analytics looks backward.
It:
-
Summarizes past data
-
Shows what has happened over a period
-
Presents information in dashboards and reports
For example:
-
Monthly revenue reports
-
Website traffic summaries
-
Customer support ticket volumes
It doesn’t explain why things happened; it simply tells you what happened.
2. Diagnostic Analytics – “Why Did It Happen?”
Diagnostic analytics goes a level deeper.
It asks:
-
Why did sales drop last quarter?
-
Why did customer complaints increase?
-
Why is this region outperforming others?
It looks for relationships, correlations, and patterns in the data to uncover root causes. This helps you fix problems at the source rather than treating only the symptoms.
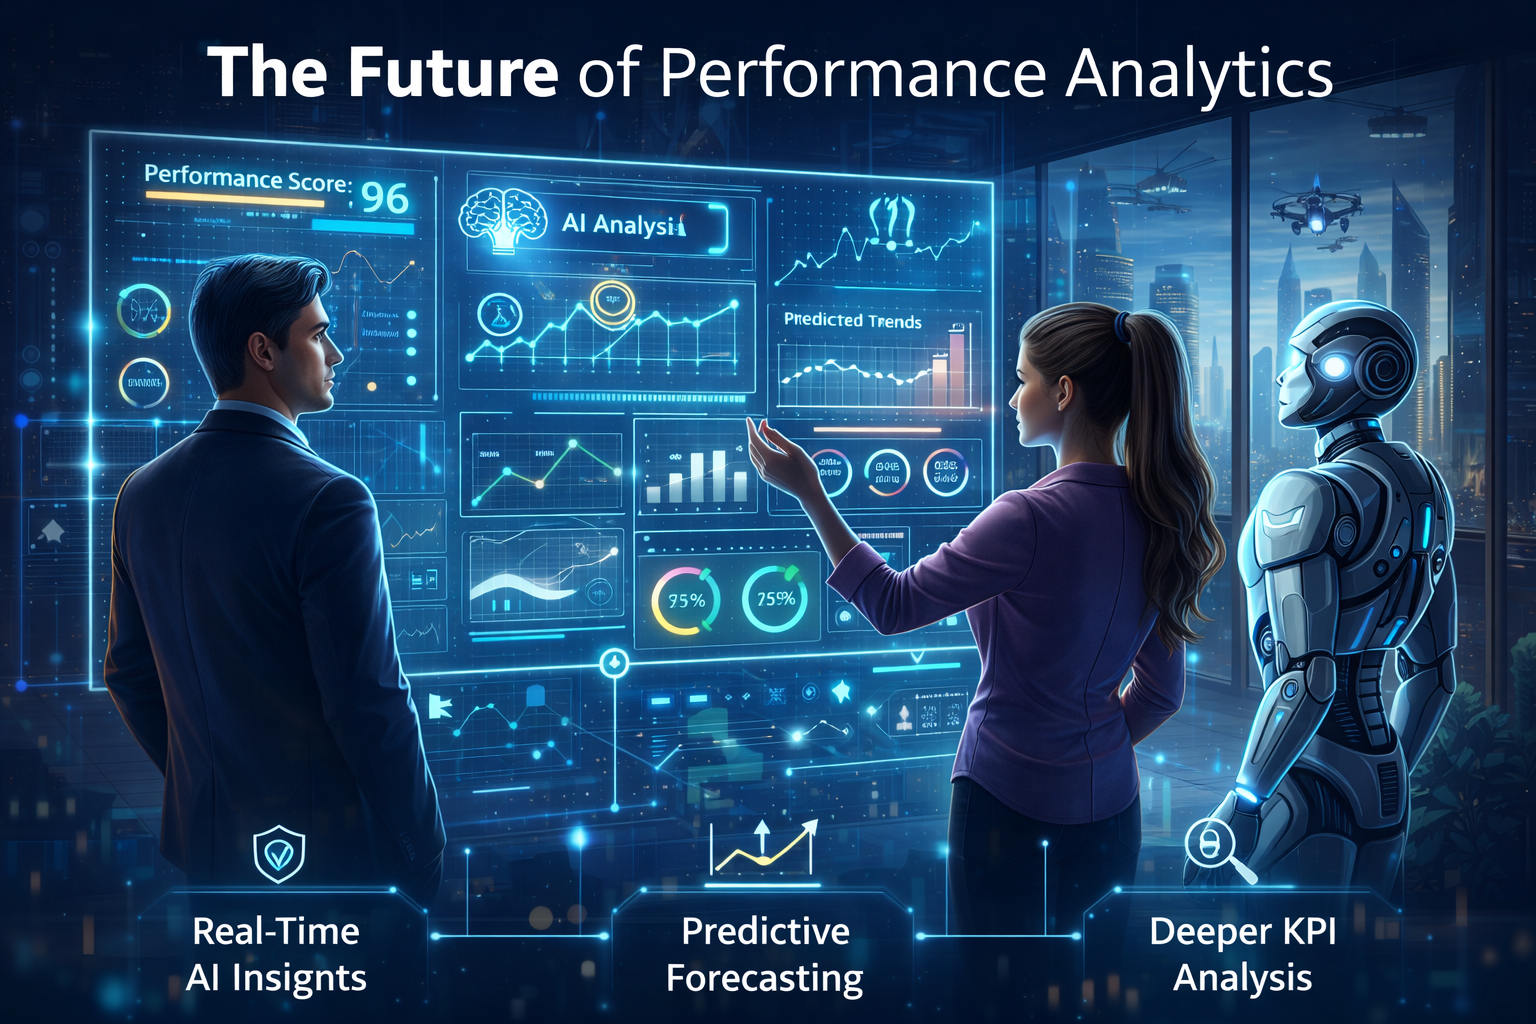
3. Predictive Analytics – “What Is Likely to Happen Next?”
This is like a data-driven crystal ball.
Predictive analytics uses:
-
Historical data
-
Statistical models
-
Machine learning algorithms
to forecast future outcomes, such as:
-
Expected demand for a product
-
Likely churn rates
-
Sales projections
You can’t predict the future perfectly, but you can make much better-informed guesses.
4. Prescriptive Analytics – “What Should We Do?”
Prescriptive analytics goes one step beyond prediction.
It:
-
Evaluates different possible actions
-
Shows likely outcomes for each
-
Recommends the best course of action
For example:
-
“If we increase discount by 5%, we might gain X more customers but lose Y in margin.”
-
“If we add a second shift, we can reduce backlog by Z%.”
Think of it as decision support with data-backed options.
5. Advanced Analytics – “What’s Hidden in Complex Data?”
Advanced analytics tackles large, complex datasets that basic reporting can’t handle well. It uses:
-
Advanced statistical methods
-
Machine learning
-
Sophisticated models
This is especially useful for:
-
Large enterprises
-
Complex operations
-
Big data scenarios (e.g., millions of transactions, IoT devices)
6. Real-Time Analytics – “What’s Happening Right Now?”
Real-time analytics focuses on current activity, not yesterday’s summary.
It lets you:
-
Monitor live dashboards
-
React instantly to issues
-
Seize opportunities as they appear
Examples:
-
Detecting website outages immediately
-
Noticing a sudden spike in demand and adjusting inventory
-
Watching live call center metrics to manage staffing
In fast-moving environments, real-time analytics can be the difference between leading the market and falling behind.
Key Performance Indicators (KPIs) in Performance Analytics
KPIs are the backbone of performance analytics. They’re the specific metrics you track to measure success.
Why are KPIs so important?
-
They make progress measurable.
-
They highlight strengths and weaknesses.
-
They align people with organizational goals.
-
They create focus and clarity.
When employees know which KPIs matter, they understand what success looks like—and they can see how their work contributes.
Some common KPIs used in performance analytics include:
-
Revenue
Total money earned in a given period. A basic but essential indicator of business performance. -
Profit
Money left after subtracting costs from revenue. Shows whether your business model is financially healthy. -
Customer Satisfaction
Often measured via surveys, Net Promoter Score (NPS), or feedback ratings. Indicates how happy customers are with your products or services. -
Employee Satisfaction or Engagement
Reflects how positive employees feel about their roles and the company. High satisfaction often correlates with better performance and lower turnover. -
Productivity
Measures how efficiently you turn resources (time, money, people) into outputs (products, services). For example, output per employee or tasks completed per hour.
Performance analytics doesn’t rely on one KPI alone. Instead, it uses a mix that reflects your strategy and goals.
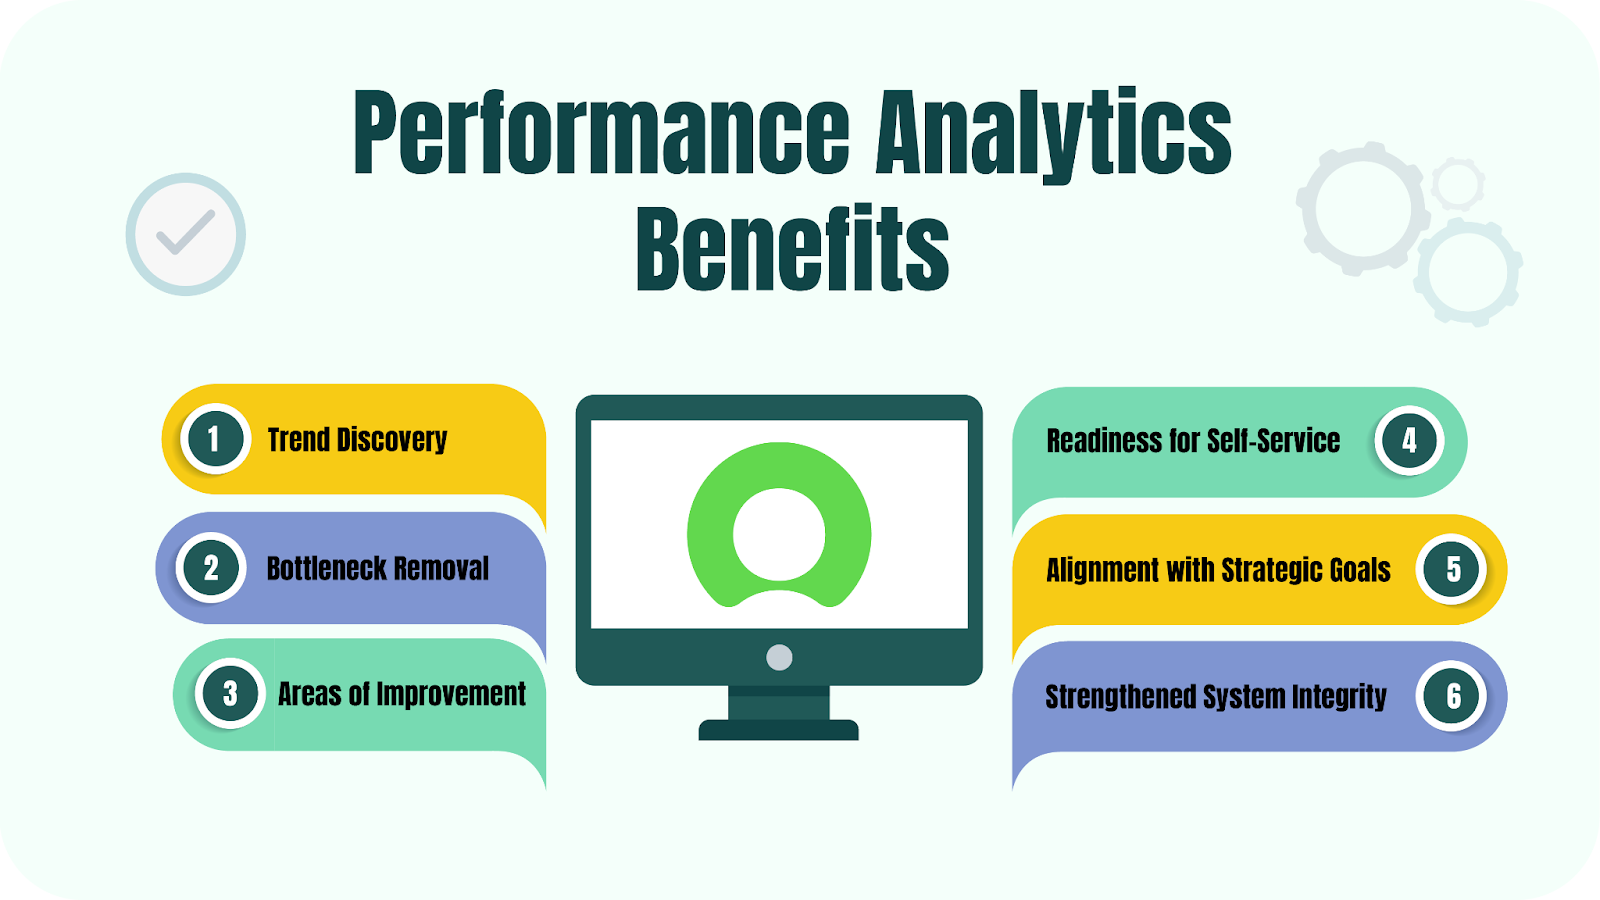
Benefits of Performance Analytics
When done well, performance analytics becomes a powerful growth engine for your organization. Here are some key benefits.
1. Better Visibility Across the Business
You gain a clear view of:
-
How different teams are performing
-
How processes are running
-
Where bottlenecks and delays appear
With this visibility, managers can identify what’s working and where support or changes are needed.
2. Data-Driven Decisions
Instead of relying on intuition alone, you make decisions based on solid evidence.
Benefits include:
-
Lower risk of costly mistakes
-
More confidence in strategic choices
-
Ability to justify decisions to stakeholders with facts, not feelings
3. Higher Operational Efficiency
Performance analytics helps you spot:
-
Inefficient processes
-
Wasted resources
-
Repeated errors or delays
Armed with this insight, you can streamline workflows, eliminate bottlenecks, and increase output without necessarily increasing cost.
4. Stronger Accountability and Fair Evaluation
When targets and metrics are clear:
-
Teams know how their performance will be measured.
-
Managers can evaluate results fairly and consistently.
-
Accountability becomes about numbers, not politics or guesswork.
This can also encourage a high-performance culture, especially when good results are recognized and rewarded.
5. Support for Continuous Improvement
Because performance analytics involves ongoing monitoring:
-
You get regular feedback on what’s working.
-
You can adjust strategies based on actual outcomes.
-
Improvement becomes a continuous habit, not a once-a-year project.
6. Better Alignment with Business Goals
When performance metrics are directly tied to business goals:
-
Departments stop working in silos.
-
Efforts across the company become more coordinated.
-
Everyone understands the bigger picture and their role in it.
7. Faster Response to Change
Performance analytics helps you detect changes early:
-
Shifts in market conditions
-
New customer behaviors
-
Internal performance issues
This early detection lets you respond quickly—before small issues become big problems or before competitors act faster than you.
Challenges of Performance Analytics
It’s not all smooth sailing. There are real challenges you’ll need to manage.
-
Data Quality Issues
Incomplete or inaccurate data leads to misleading insights. “Garbage in, garbage out” definitely applies here. -
Integration Problems
Data often sits in separate systems with different formats. Bringing it together into a single, consistent view can be tricky. -
Skills and Understanding
Not everyone is comfortable with data. Without proper training, teams might misinterpret insights or ignore them completely. -
Cultural Resistance
Moving from intuition-driven to data-driven decision-making can feel threatening to some people. It requires leadership, communication, and time.
Recognizing these challenges upfront helps you plan for them and avoid disappointment.
Performance Analytics vs Performance Appraisals
It’s easy to confuse performance analytics with performance appraisals, but they’re not the same thing.
-
Performance analytics focuses on business performance: systems, processes, outcomes.
-
Performance appraisals focus on individual employees: their contributions, behavior, and growth.
You can think of it this way:
-
Performance analytics answers: “How is the business or process performing?”
-
Performance appraisals answer: “How is this person performing?”
Analytics tends to be more data-driven and continuous, while appraisals are often periodic and partly subjective. Both matter, but they serve different purposes.
Traditional Performance Review vs. Performance Analytics
Traditional performance reviews:
-
Happen once or twice a year
-
Rely heavily on manager opinions
-
Look backward at past performance
-
Can be biased and inconsistent
Performance analytics:
-
Runs continuously or in near real-time
-
Uses actual performance data
-
Focuses on ongoing trends and patterns
-
Feeds directly into proactive improvement
Modern organizations increasingly use analytics to complement or even reshape how they evaluate performance at both team and business levels.
How to Execute Performance Analytics
If you want to put performance analytics into practice, here’s a straightforward way to approach it.
-
Set Clear Objectives
Decide what you’re trying to improve: productivity, engagement, profitability, customer satisfaction, etc. A clear purpose gives direction to your analytics efforts. -
Define the Workflow and Responsibilities
Who will collect data? Who will analyze it? Who will act on the findings? Make the process clear so it doesn’t fall through the cracks. -
Choose Relevant KPIs
Pick KPIs that genuinely reflect your goals. Don’t track everything—track what matters. -
Use Reliable Data Sources
Make sure the systems you pull data from are accurate, secure, and consistent. -
Get Buy-In from Leaders and Teams
Explain why you’re using performance analytics, how it benefits everyone, and how the data will be used. Transparency builds trust. -
Ensure Data Quality and Integration
Clean, validate, and integrate data from different systems. Bad or fragmented data will undermine the entire effort. -
Select the Right Tools and Train People
Use software that matches your needs and skills. Train your team in basic data understanding so they feel confident using insights. -
Use Benchmarking
Compare performance over time and, where possible, against industry standards. This helps you see progress and gaps. -
Focus on Actionable Insights
Don’t just collect data and admire charts. Turn insights into action plans with owners and timelines. -
Protect Data and Plan for Scale
Safeguard sensitive information and use systems that can grow with your business. Automate where you can to reduce manual work.
Mastering Business Performance Analytics in 10 Clear Steps
Let’s break it down into a simple, step-by-step path you can follow.
- Set Clear Objectives
Decide what you want to achieve: higher engagement, better productivity, reduced churn, improved profitability, etc. - Identify Relevant KPIs
Pick metrics that clearly show whether you’re moving toward those objectives. - Collect and Integrate Data
Gather data from reports, surveys, systems, and feedback channels. Make sure it’s accurate and connected across sources. - Build Dashboards and Reports
Create visual dashboards that make it easy for teams to understand what’s happening at a glance. - Benchmark and Compare
Compare current performance with past periods and, when possible, industry peers. - Conduct Root Cause Analysis
When you see a problem, dig deeper. Use tools like the “5 Whys” to uncover what’s really driving it. - Analyze Performance Driver
Combine quantitative data with qualitative input from teams to understand what influences performance most. - Spot Trends and Pattern
Look for recurring patterns that explain improvements or declines. - Plan and Implement Action
Create practical action plans. Assign responsibilities, set timelines, and define what success looks like. - Maintain Continuous Feedback
Keep communication open. Review results regularly, adjust as needed, and encourage feedback from the people closest to the work.
Popular Tools Used for Performance Analytics
You don’t need to build everything from scratch. Several platforms can help you collect, analyze, and present data effectively.
ServiceNow Performance Analytics
ServiceNow Performance Analytics focuses on:
-
Operational performance
-
Workflows
-
Service delivery
It provides:
-
Real-time dashboards
-
Trend tracking
-
Insight into process efficiency
This helps teams spot performance gaps early and make improvements before issues grow.
SAP SuccessFactors
SAP SuccessFactors is centered on:
-
Workforce performance
-
HR and talent management
-
Engagement and alignment
It helps you:
-
Connect individual performance with business goals
-
Track employee productivity and development
-
Identify training and support needs
Great for organizations focused on building a strong, aligned workforce.
Salesforce
Salesforce is widely used for:
-
Sales performance analytics
-
Customer behavior insights
-
Pipeline management
You can:
-
Monitor leads, opportunities, and deals
-
Analyze revenue trends
-
Understand customer interactions across touchpoints
This visibility supports better sales strategies and stronger customer relationships.
NetApp
NetApp is used at the infrastructure level for:
-
System performance monitoring
-
Storage and data management
-
Availability tracking
It helps IT teams:
-
Detect performance issues early
-
Optimize system usage
-
Support stable digital platforms that the rest of the business relies on
Microsoft Dynamics 365 Finance
Microsoft Dynamics 365 Finance focuses on:
-
Financial performance
-
Revenue and expense tracking
-
Cash flow and budgeting
It gives leaders:
-
Up-to-date financial insights
-
Trend analysis
-
Tools to align budgets with strategic goals
This supports healthy, sustainable financial decision-making.
Use Cases and Real-World Examples of Performance Analytics
Performance analytics shows up in many parts of a business. Here are a few practical examples.
-
Sales Analytics
Track revenue growth, conversion rates, and pipeline health. Use insights to refine sales tactics, prioritize leads, or adjust pricing. -
Supply Chain Analytics
Monitor inventory levels, delivery timelines, and supplier performance. Improve efficiency, reduce stockouts, and cut unnecessary costs. -
Website and Digital Analytics
Analyze page load times, traffic patterns, and user engagement. Use that data to improve user experience, content, and conversion flows.
In each of these cases, the formula is similar: measure → understand → act → improve.
Conclusion
If you imagine your business as a vehicle on a long journey, performance analytics is your dashboard. Without it, you can still drive—but you won’t know your speed, fuel level, or warning signals until it’s too late. With it, you get constant feedback that helps you adjust, stay on track, and reach your destination safely and efficiently.
The companies that thrive in the next decade won’t necessarily be the ones with the most data—they’ll be the ones that know how to turn that data into action. Starting with performance analytics is one of the simplest, most practical ways to do exactly that.